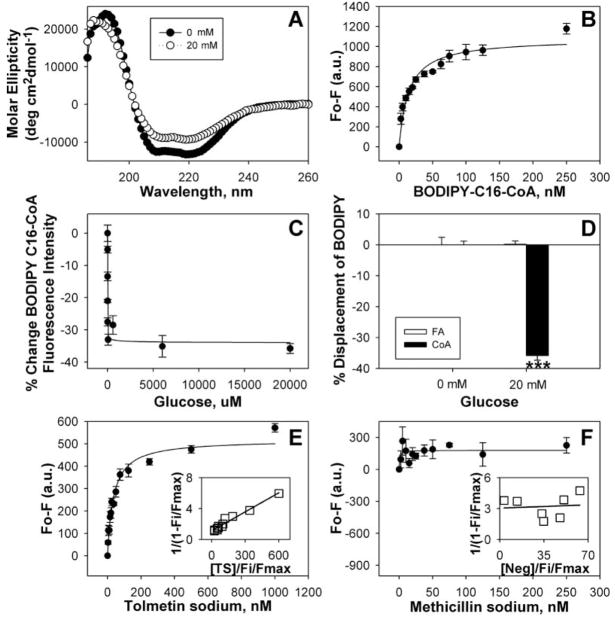
FIG. 1.
Circular dichroic (CD) spectra and ligand binding assays with peroxisome proliferator-activated receptor-α (PPARα). (A) CD spectra of PPARαΔAB with 0 mM (filled circles) and 20 mM (open circles) glucose. Each spectrum represents an average of 10 scans for a given representative spectrum from 3 replicates. (B) Binding curve of the change in fluorescence intensity (Fo-F) of PPARαΔAB titrated with BODIPY-C16-CoA. (C) The percentage change in PPARα binding to BODIPY-C16-CoA as a function of glucose concentration. (D) The percentage change in PPARαΔ AB binding to BODIPY-C16 (open bars) and BODIPY-C16-CoA (filled bars) in the presence of 20 mM glucose, measured as the change in fluorescence intensity after background subtraction. Asterisks represent significant differences as compared with the no glucose control. *p < 0.05, **p < 0.01, ***p < 0.001. (E, F) Binding curves of the change in PPARαΔAB intrinsic fluorescence in the presence of 20 mM glucose upon titration with tolmetin sodium (E) and methicillin sodium (negative control) (F). Values are the mean ± SEM (n = 3–4). Insets are double reciprocal plots of the mean binding curve data presented in each panel.

