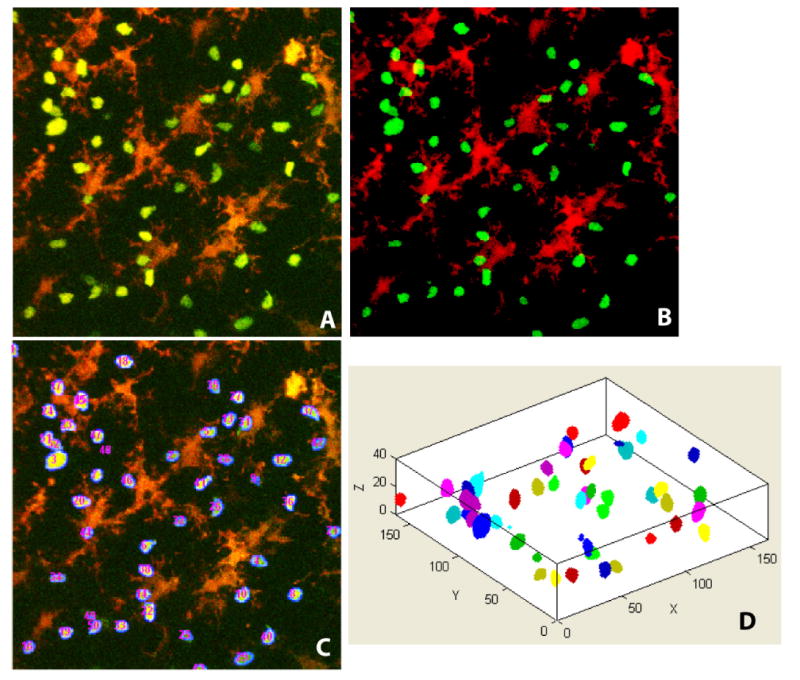
Figure 2.

(A) Sample image shown as a 2-D maximum-intensity projection of a full 3-D stack at a randomly chosen sampling time; (B) Results of detecting thymocytes and dendritic cell voxels – thymocyte voxels are displayed in green and DC voxels are displayed in red. Partially imaged cells appear as fragments. (C) Numbered voxel clusters corresponding to thymocytes. (D) An oblique 3-D view of the segmented thymocytes for the same image stack.
