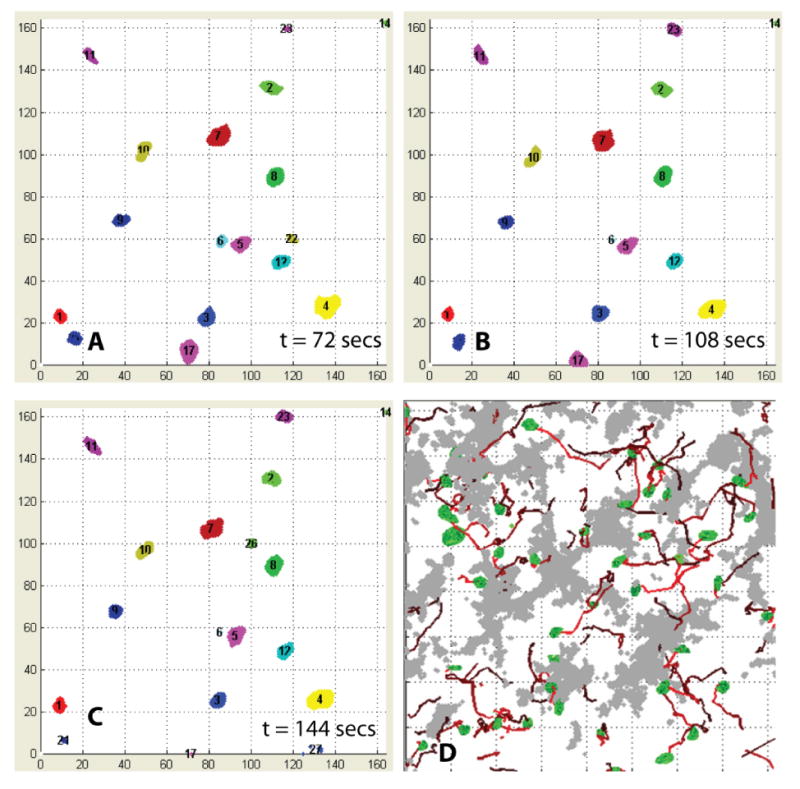
Figure 3.

(A – C) Sample cell tracking results for wild-type thymocytes at three successive time points: each tracked thymocyte is numbered, and displayed in consistent colors. (D) Sample display of cell migration paths (red lines) for wild-type thymocytes over 40 time points. Thymocytes segmented in the first frame are displayed in green. The colored paths represent trajectories of migrating thymocytes, coded to depict their temporal ordering (initial points are shown in bright red and later points in dark red).
