
Figure 4.
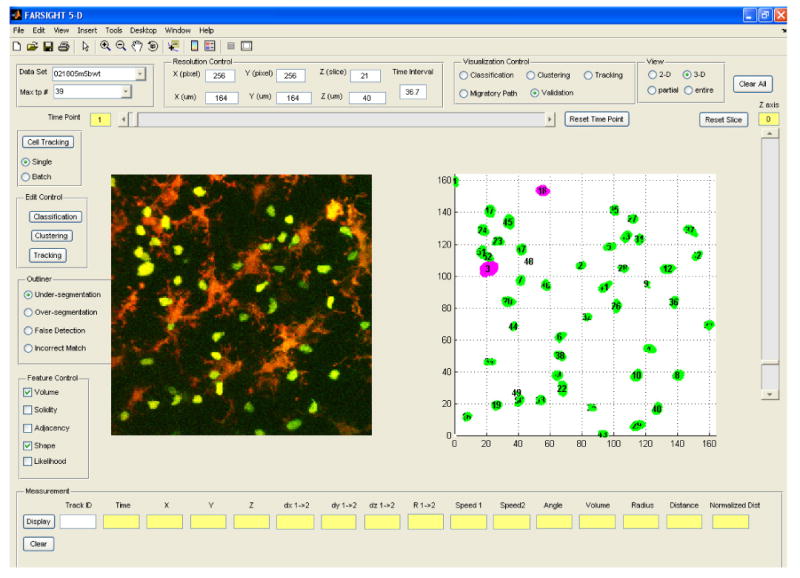
Screen view of the graphical tool for computer-assisted inspection and editing of automated analysis results. The operator can choose features for detecting each type of outliers, and the outliers are displayed in pink, while normal cells are displayed in green. The cells highlighted in pink are statistical outliers that are proposed by the software as candidates for closer inspection and editing.