
Figure 5.
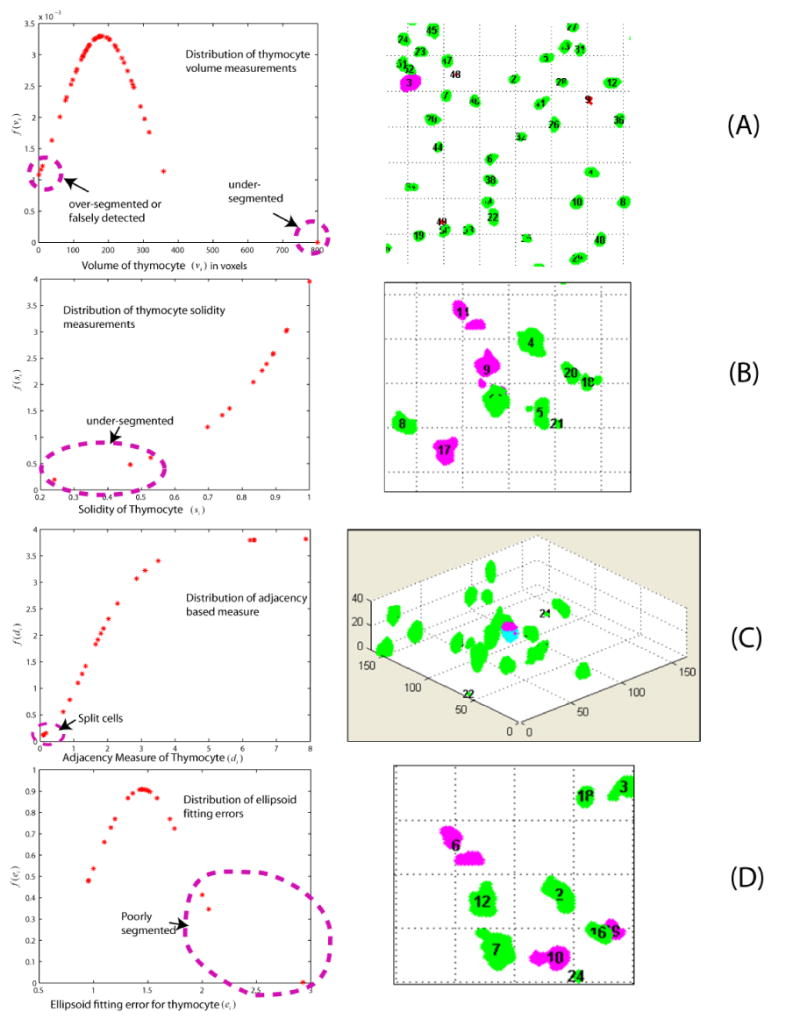
Illustrating the outlier based method to highlight potential errors for closer inspection and editing. The detected outliers marked by the pink ellipse in the left column correspond to the objects highlighted in pink in the right column. (A) Thymocytes with low f(vi) values are under-segmented, over-segmented, or falsely detected. (B) Thymocytes with low f(si) values are under-segmented. (C) Thymocytes with low f(di) values are fragmented. The fragments displayed in dark pink and bright blue should be merged into a complete cell. (D) Low f(ei) values usually indicate poorly segmented thymocytes.