
Figure 9.
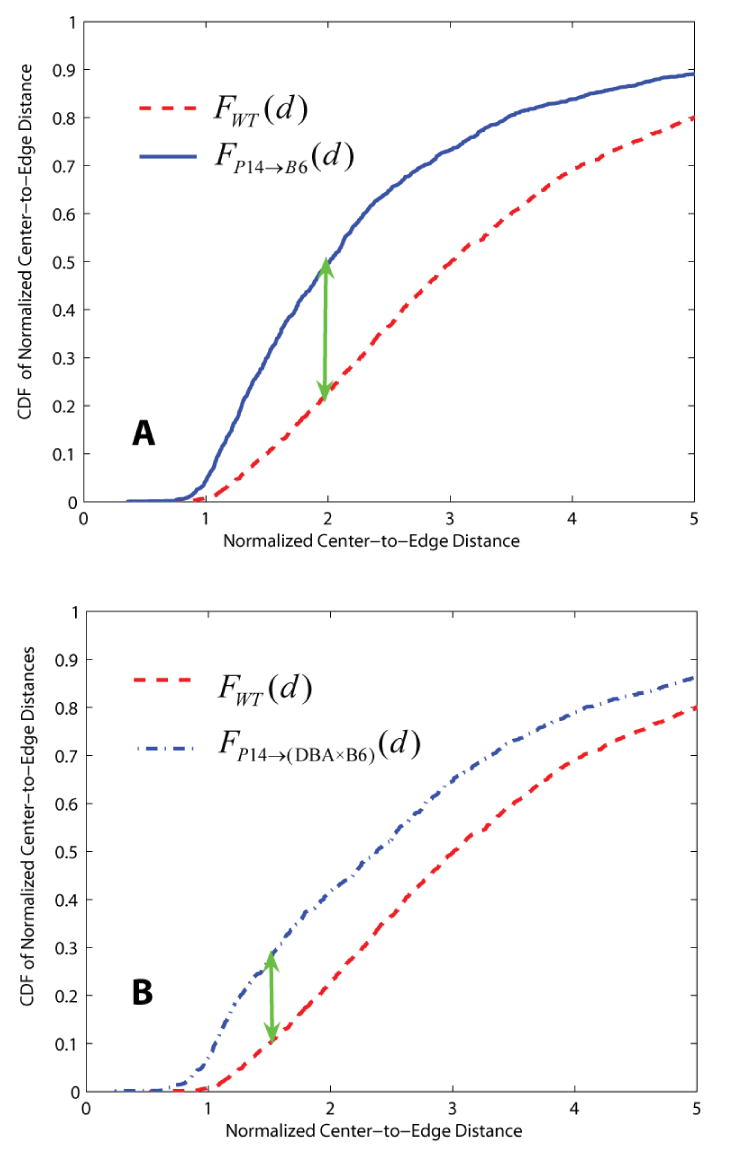
Examples illustrating dissimilarity between the distributions of wild type and P14 selections characterizing the thymocyte-DC center-to-edge distances. The cumulative distribution functions (CDFs) in both Panel A and B indicate that normalized center-to-edge distances for P14 selections have many more smaller values compared to wild-type thymocytes. The green arrows indicate the location of highest dissimilarity between CDFs of wild type and P14 selections for a single run. The Kolmogorov-Smirnov test and Mann-Whitney U-test confirm that the distributions are statistically different (shown as entries in bolded and underlined font in Table 5 and Table 6).