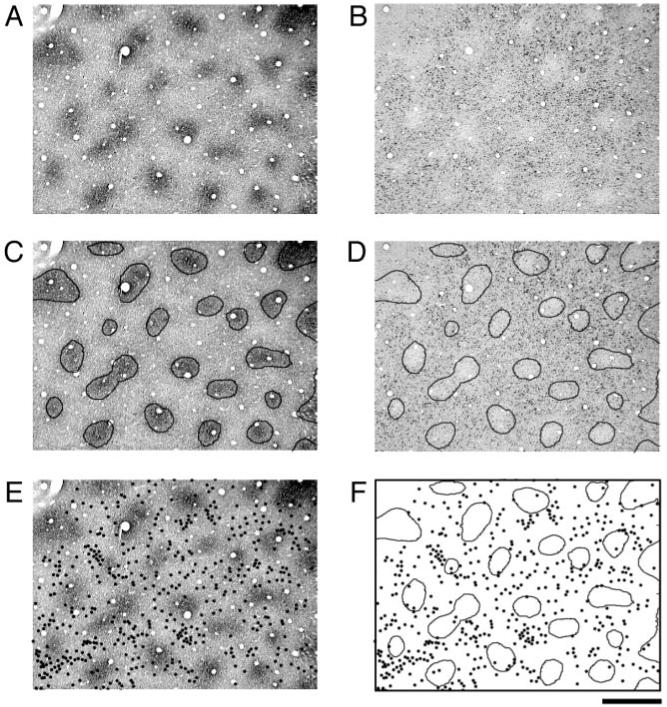
Figure 4.

Another example of the relationship between CO blobs (A) and SMI-32 labeling (B) in V1 from a different monkey. The regions defined by contours generated around CO blobs (C) were within regions that were light for SMI-32 labeling (D). Individual SMI-32 positive neurons were plotted as black dots superimposed onto the adjacent CO section (E). Comparison of these two patterns shows that SMI-32 labeled cells fall preferentially within inter-blob regions (F). Scale bar = 500 μm.
