
Figure 6.
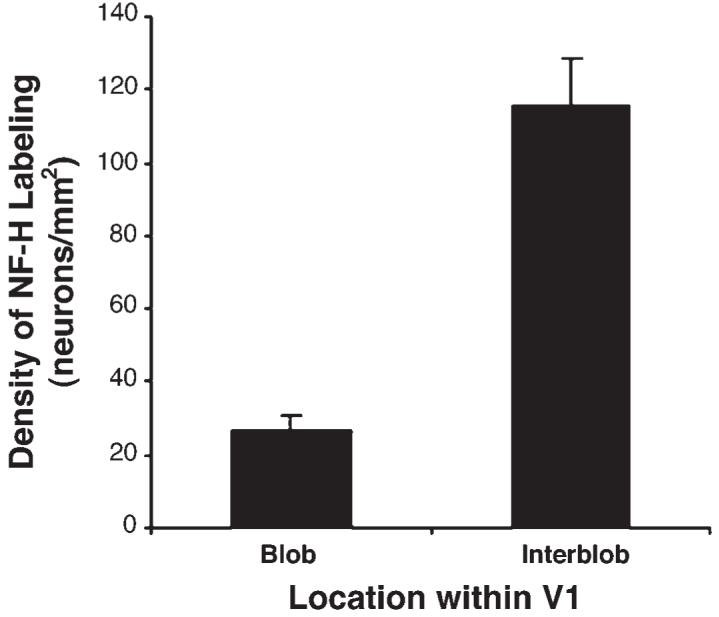
Quantification of the spatial relationship between SMI-32 labeling and CO blobs. The distribution of SMI-32 labeled cells was plotted from a 5 mm2 area of V1 for each of the five hemispheres we examined. In this graph, the density of labeled cells inside of blobs and interblobs is plotted. The density of SMI-32 positive neurons is significantly greater within interblobs (P < 0.001; t-test). Error bars represent the standard error of the mean.