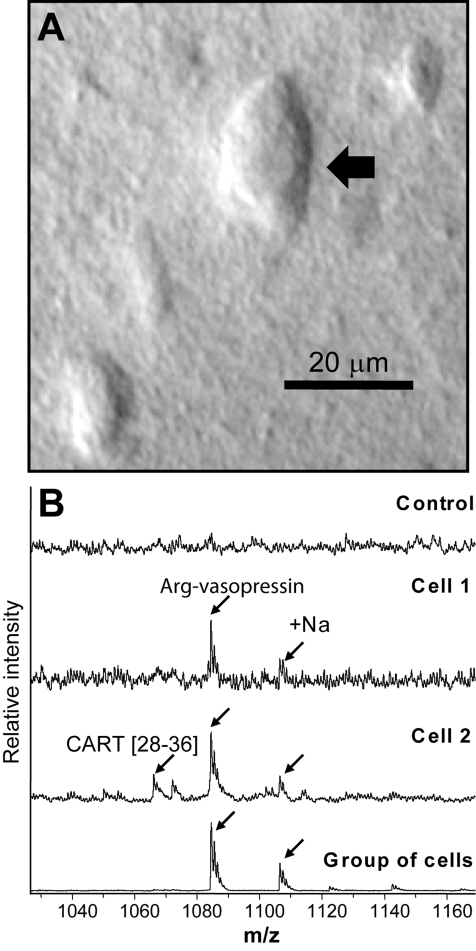
Figure 3.
(A) Photomicrograph of a neuron isolated manually from a glycerol-treated brain slice. (B) Mass spectra acquired from individual MCN neurons using saturated DHB matrix: top trace, mass spectrum from a neuron isolated from a brain slice treated with glycerol; middle traces, individual neuron spectra; bottom trace, a group of SON cells.

