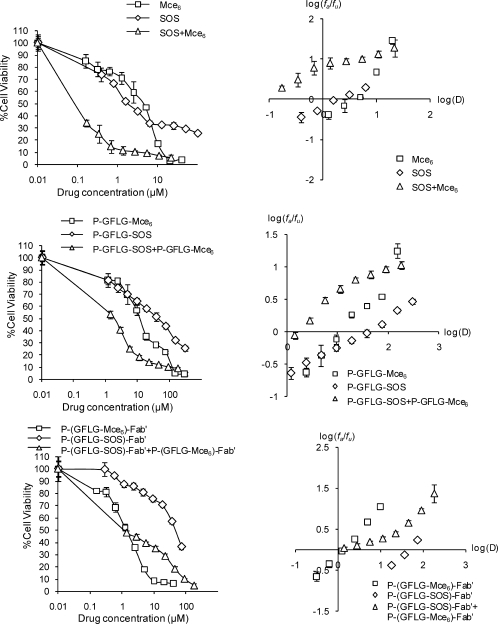
Figure 4.
Dose response curves and median-effect plots of OVCAR-3 cells treated with Mce6, SOS, P-GFLG-Mce6, P-GFLG-SOS, P-(GFLG-Mce6)-Fab′, and P-(GFLG-SOS)-Fab′ as single agents and sequential combinations at constant ratios of their respective IC50 concentrations. Bars represent standard error (n = 6 in single experiment).

