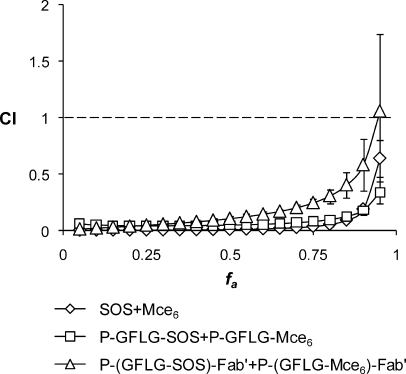
Figure 5.
Combination index plots (fa−CI plots) obtained from median-effect analysis. Chemotherapeutic drugs and their HPMA copolymer conjugates were gradually diluted at the ratio of their IC50 values as a series of 2-fold dilutions from 4 to 0.03125 times IC50 and OVCAR-3 cells exposed to drugs sequentially as described in . CI < 1, = 1 and > 1 indicate synergism, additive effect, and antagonism, respectively. The vertical bars indicate the 95% confidence intervals based on sequential deletion analysis (SDA) and can be generated by using CompuSyn software.

