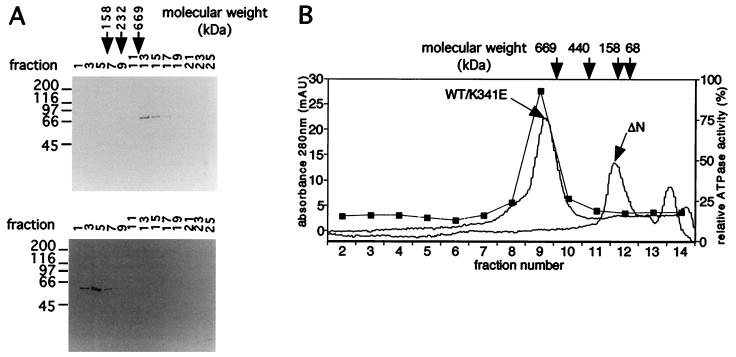
Figure 5.
Estimation of the native molecular mass of MtMCM protein. (A) wt and ΔN proteins were sized by sucrose gradient sedimentation, and fractions were subjected to SDS/PAGE and stained with Coomassie blue. (B) Samples were also sized by gel filtration. Gel filtration fractions were assayed for ATPase activity (■). Activity coeluted only with the peak of wt protein.

