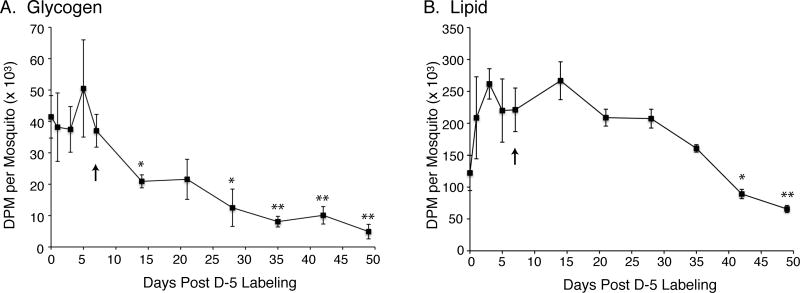
Figure 5.
Time course of 14C-labeled glycogen and lipid metabolism in diapausing D-5 mosquitoes during the late diapause phase. Data are presented as mean ± SEM of DPM/mosquito from three independent experiments. A) Data from 14C-glycogen pools. B) Data from 14C-lipid pools. One-way ANOVA with Tukey’s multiple comparison test was used for statistical comparison between day 7 of diapause (arrow) and later time points showing p≤0.05 as (*) and p≤0.01 as (**).

