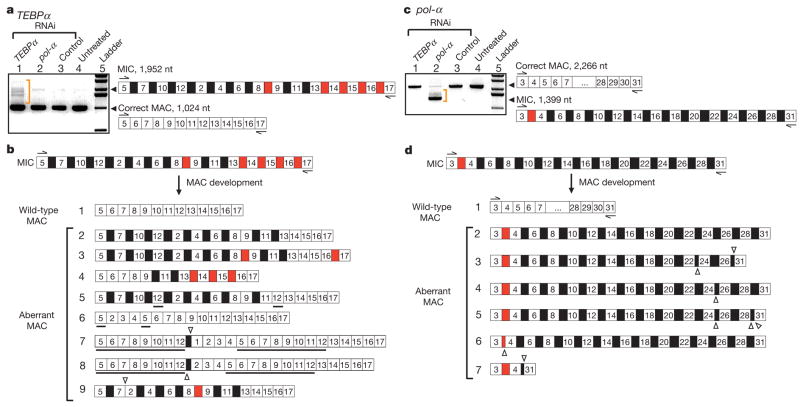
Figure 1. RNAi against putative RNA templates leads to disruption of DNA rearrangement, with accumulation of aberrant products.
MDS segments (white boxes) and IES regions (black boxes if located between nonconsecutive segments, red if consecutive) are drawn schematically, not to scale. The ladders are 1 kb (Invitrogen). a, PCR amplification of the TEBPα region between segments 5 and 17 from total DNA extracted from the sources treated with: TEBPα RNAi, pol-α RNAi and control double-stranded (ds)RNA (184 nucleotide (nt) dsRNA from feeding vector polylinker), as well as untreated cells. Only cells treated with TEBPα RNAi contain partial or incorrect rearrangements, on the basis of size (orange bracket). Cells treated with TEBPα RNAi were fed with dsRNA covering the region between segments 1 and 16. MAC, macronucleus; MIC, micronucleus. b, The sequence of several TEBPα PCR products between segments 5 and 17 in cells treated with TEBPα RNAi. IESs between both scrambled (black) and nonscrambled (red) MDSs are deleted from some molecules at both correct and incorrect (cryptic) repeats. Open triangles show the locations of cryptic junctions between neighbouring segments (if pointing up) and non-neighbouring segments (pointing down) on the basis of the precursor micronuclear order. Underlined segments are duplications. c, PCR amplification of pol-α between segments 3 and 31 from total DNA extracted from sources treated with: TEBPα RNAi, pol-α RNAi and control dsRNA (as above), as well as untreated cells. Only cells treated with pol-α RNAi show aberrantly rearranged products, on the basis of size (orange bracket). Cells treated with pol-α RNAi were fed with dsRNA covering the region between segments 16 and 29. d, Sequence of several pol-α PCR products between segments 3 and 31 in cells treated with pol-α RNAi.

