
Figure 5.
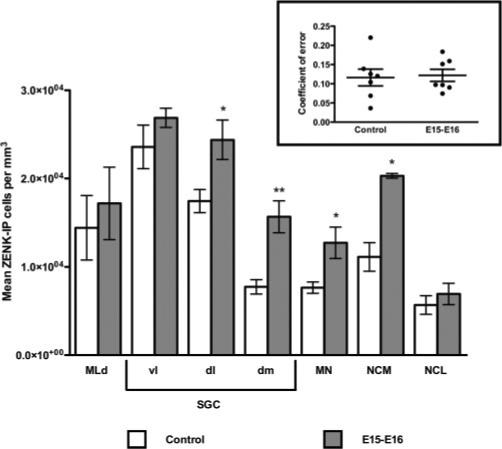
ZENK-IP cell number per unit tissue volume for each brain region of interest, for birds receiving prenatal stimulation during E15–E16, or no prenatal stimulation (controls). ZENK-IP cell number was significantly greater for dlSGC, dmSGC, MN, and NCM. Significance reflects values from paired-samples t-tests, *p < 0.05; **p < 0.01. Inset: coefficient of error for number of cells counted per brain, per region; dots are mean CEs per brain region, lines are means and SEMs per group.