Figure 1.
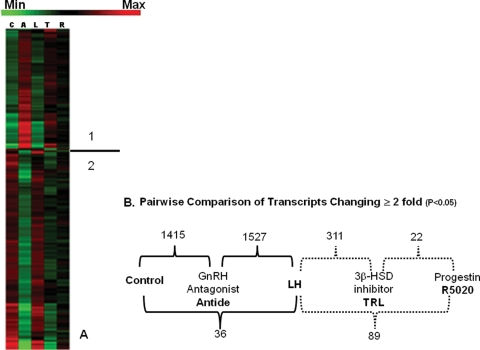
(A) Cluster analysis by multiple comparison procedure of GeneSifter© of all transcripts whose levels significantly (P < 0.05) changed in expression ≥2-fold when compared with control CL. The heat map indicates the relative levels of the expression of each transcript, with red indicating increased expression and green indicating decreased expression. The line separates the two regions of different transcript expression: 1: increasing expression with Antide treatment; 2: decreasing expression with Antide treatment. C, control; A, Antide; L, A + LH; T, A + LH + TRL; R, A + LH + TRL + R5020. (B) Summary of pairwise comparison analysis of the number of transcripts identified by GeneSifter© as significantly changing expression ≥2-fold (Student’s t-test, P < 0.05) between indicated treatment groups. Comparisons between complimentary ablation/replacement groups are indicated on the top, whereas pairwise comparisons between control and A + LH, or A + LH and A + LH + TRL + R5020 treatments are depicted below. For example, 1415 transcripts differ significantly between the control and Antide treatment groups, whereas only 36 differ significantly between the control and Antide + LH treatment groups. The number of transcripts whose expression differs between control, Antide and A + LH groups (black brackets) are greater than those between A + LH, A + LH + TRL and A + LH + TRL + R5020 groups (dashed brackets).

