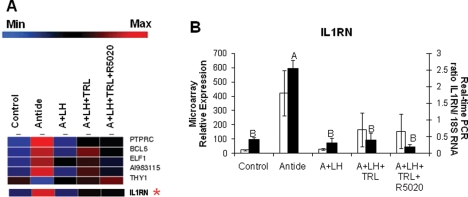
Figure 2.
A list of regulated transcripts identified by GeneSifter© from the KEGG ontology ‘Negative Regulation of Immune System Process’ (as in Table III) as significantly (one-way ANOVA, P < 0.05) affected by treatments is shown in Panel A (blue indicates minimum expression, whereas red indicates maximum). A comparison of interleukin 1 receptor antagonist (IL1RN; mean ± SEM) results is depicted in Panel B, with white bars representing microarray values (GeneSifter© one-way ANOVA, P < 0.05), and black bars representing real-time PCR data (one-way ANOVA, P < 0.001; different letters signify treatment groups with significantly different values, P < 0.05).

