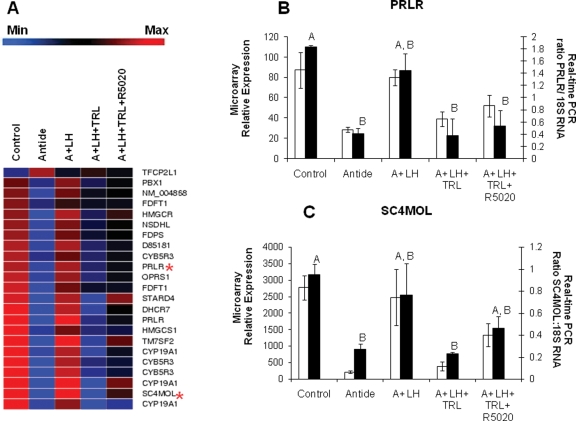
Figure 3.
A list of transcripts identified by GeneSifter© from the KEGG ontology ‘Steroid Biosynthetic Process’ (similar to Table III) as significantly (one-way ANOVA, P < 0.05) affected by treatments is shown in Panel A (blue indicates minimum expression, whereas red indicates maximum expression). The red stars indicate the relative expression of transcripts for the PRLR and SC4MOL. Real-time PCR results for PRLR (Panel B; one-way ANOVA, P < 0.01) and SC4MOL (Panel C; one-way ANOVA, P = 0.01) are compared with microarray results (P < 0.05). See the legend of Fig. 2 for more details.

