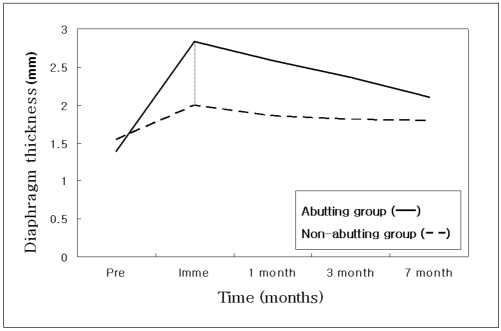
Fig. 1.
Comparison of diaphragm thickness between abutting group A and non-abutting group B.
Graph shows changes in diaphragmatic thickness in two groups after radiofrequency ablation. Mean increase in diaphragmatic thickness between pre- and immediately after radiofrequency ablation on CT scanning was 1.44 mm for abutting group A and 0.46 mm for non-abutting group B. This difference was statistically significant (p < 0.01). Diaphragmatic thickness spontaneously decreased over time.

