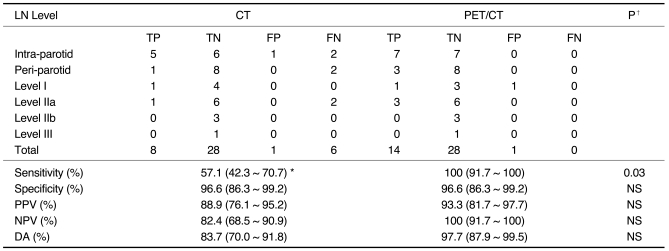
Table 2.
Diagnostic Values for Contrast-Enhanced CT and PET/CT with Regard to Regional Lymph Node Metastasis in Patients with Periorbital Malignancies on Lymph Node Level-by-Level Analysis (n = 43 node levels)
Note.-LN level = lymph node level, TP = true positive, TN = true negative, FP = false positive, FN = false negative, PPV = positive predictive value, NPV = negative predictive value, DA = diagnostic accuracy, NS = not statistically significant *95% CI = 95% confidence interval using Wilson's method. ‡ Comparison of diagnostic values between CT and PET/CT using McNemar test.

