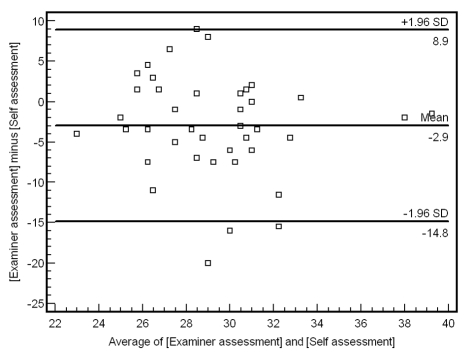
Figure 5.
Bland and Altman plot for saphenofemoral junction ligation. The average of the examiner and self-assessment scores on the horizontal axis and the difference between examiner and self-assessment scores on the vertical axis. The central horizontal line represents the mean difference between the two scores (2.9 marks).

