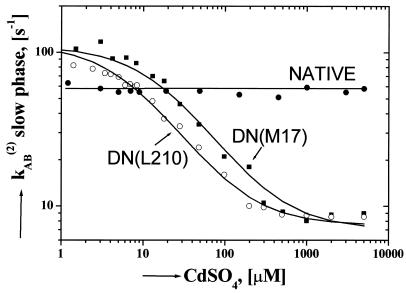
Figure 2.
The slow phase of kAB(2) as a function of CdSO4 concentration for native (●), and mutant DN(M17) (■) and DN(L210) (○) RCs. In native RCs, kAB(2) is independent of CdSO4 concentration above 10 μM. In mutant RCs, kAB(2) displays a sigmoidal dependence on CdSO4 concentration. The solid curve represents a theoretical fit using the kinetic model described by Eq. 5 (see also Eq. A4 of Appendix) with the parameters shown in Table 2. The drastic difference in behavior between native and mutant RCs is because of the lack of competition of koff with kAB(2)(Cd2+) in native RCs (see Discussion). Conditions: same as in Fig. 1.

