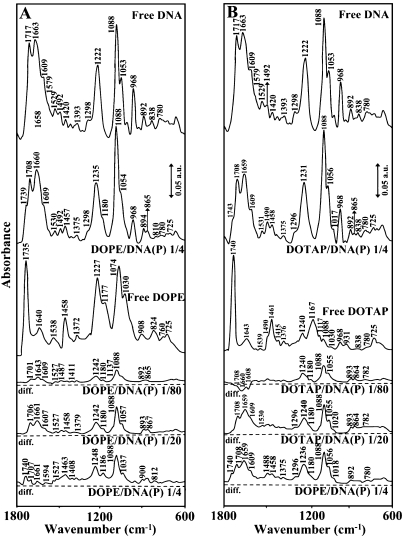
Figure 3.
FTIR spectra and difference spectra [(DNA solution + lipid solution) − (DNA solution)] in the region of 1800 − 600 cm−1 for the free calf-thymus DNA and free DOPE (A) and DOTAP (B) and their complexes in aqueous solution at pH 7.3 with various lipid/DNA(P) ratios (1/80 to 1/4) and constant DNA concentration (12.5 mM).

