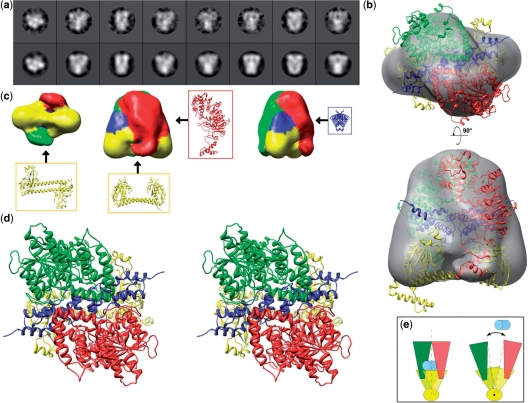
Figure 1.
EM data, 3D reconstructions and model for the M.EcoKI–ocr complex. (a) Eight selected EM class average images (top row) with their corresponding reprojections of the EM map (second row), showing a range of views. (b) Two orthogonal semi-transparent surface representations of the EM 3D reconstruction each with a view of the modelled coordinates fitted as a rigid body (green and red—HsdM; blue—ocr dimer; yellow—HsdS). (c) Three surface views of the M.EcoKI–ocr EM 3D reconstruction coloured according to proximity to the fitted coordinates, with the positions of individual protein chains indicated with arrows. (d) A stereo view of the M.EcoKI–ocr atomic model. (e) Schematic diagram of proposed mechanism of clamping and release of DNA substrate (light blue) facilitated by twisting of the coiled-coil (yellow, viewed end-on).

