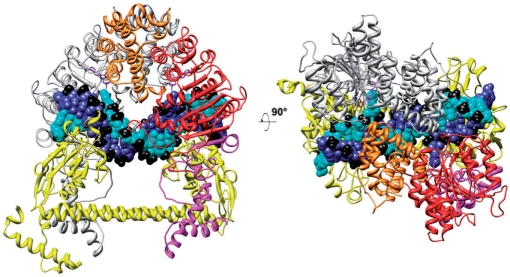
Figure 2.
Model of the EcoKI MTase in complex with substrate DNA and AdoMet cofactors. HsdS is shown in yellow, the HsdM at the rear is shown in grey, DNA strands are shown in blue and cyan with phosphates in black, the two AdoMet molecules in purple. The HsdM in the foreground shows the N-terminal domain (aa 1–153) in orange, the catalytic domain (aa 154–469) in red and the C-terminal domain (aa 470–529) in magenta.

