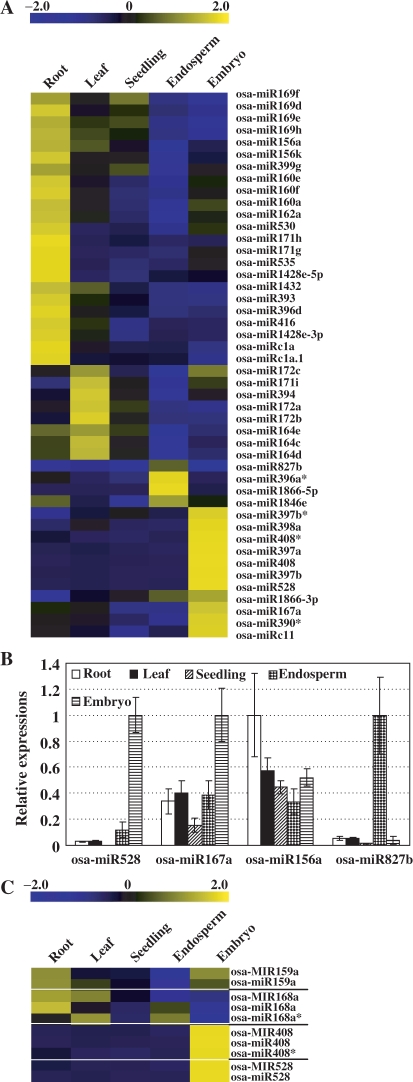
Figure 3.
Expression patterns of the known and novel miRNAs. (A) Some miRNAs were preferentially expressed in specific tissues. Several miRNA*s were included. The bar represented the scale of relative expression levels of miRNAs (Log2). (B) Quantitative real-time RT-PCR analysis on the relative expressions of miRNAs in various tissues. The copy numbers of miRNAs were normalized by comparing to that of rice 5.8S rRNA, and expression levels of each miRNA were then normalized by comparing to the highest expression in the tested tissues, which was set as 1.0. The experiments were repeated for three times and error bar represented SD. (C) Close relation of the expression levels of pri-miRNAs (labeled as osa-MIRxxx, by GeneChip® microarray hybridization) and corresponding mature miRNAs (labeled as osa-miRxxx, by miRNA chips). The bar represented the scale of relative expression levels of pri-miRNAs or mature miRNAs (Log2). The white lines compart the pri-miRNAs and the corresponding mature miRNAs into groups.

