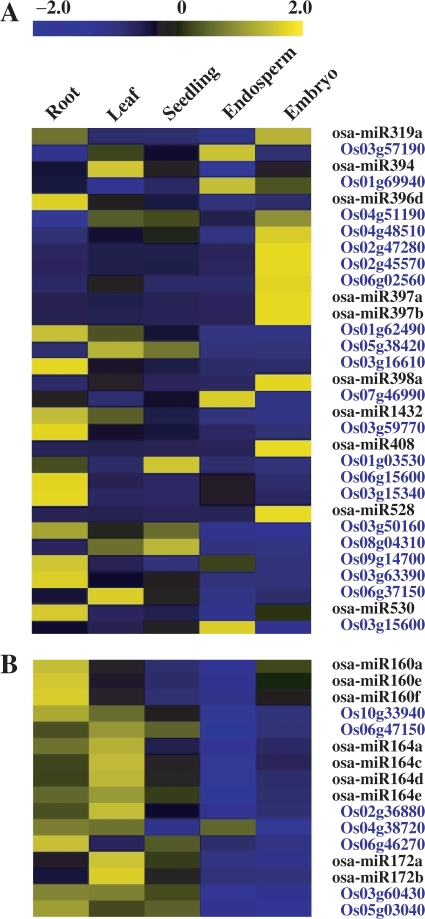
Figure 4.
Expression correlations of miRNAs and the corresponding targets. In each miRNA/target pair (blue characters), the LOC prefixes of TIGR locus identifiers were removed for convenience. The bar represented the scale of relative expression levels of miRNAs or targets (Log2). (A) miRNAs expresssions negatively correlated to those of the corresponding targets. The abundances of targets were low in the tested tissues while miRNAs were highly accumulated. (B) miRNAs expresssions postively correlated to those of the targets. Both the targets and miRNAs were highly accumulated in the same tissue(s).

