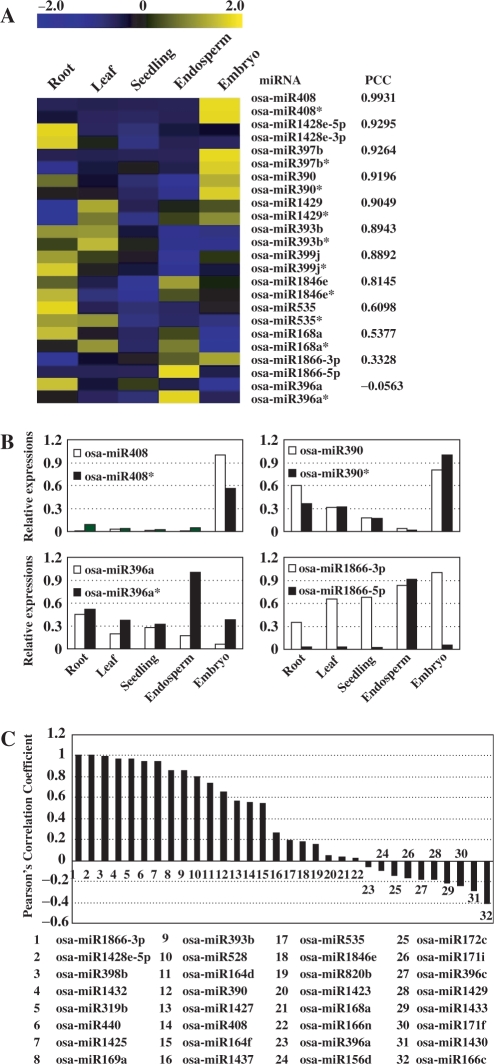
Figure 5.
The correlated expressions of miRNAs and miRNA*s. (A) Correlation of the abundance between miRNAs and miRNA*s was presented by Pearson's correlation coefficient (PCC). The bar represented the scale of the relative expression levels of miRNAs and miRNA*s (Log2). (B) Relative expression levels of miRNAs and miRNA*s. For osa-miR408 and osa-miR390, miRNAs and miRNA*s accumulated highly in same tissues. For osa-miR396a and osa-miR1866-3p, differential accumulation patterns of miRNAs and miRNA*s were detected. Expression levels of miRNAs and miRNA*s were normalized by comparing to the highest expression among them, which was set as 1.0. (C) Pearson's correlation coefficient (PCC) of the abundance between miRNAs and miRNA*s in seven sRNAs libraries. sRNAs originated from multiple precursors were filtered out. The IDs of miRNAs were listed in lower panel.

