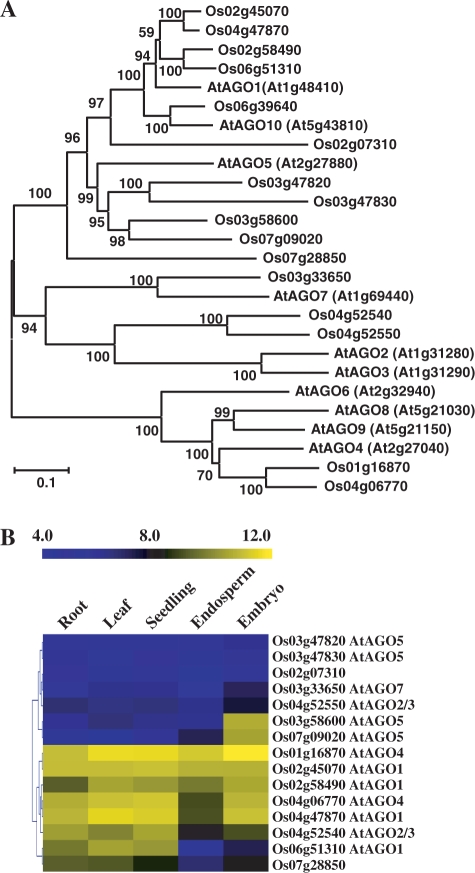
Figure 6.
Phylogenetic and expression pattern analysis of rice AGOs. The LOC prefixes of all TIGR locus identifiers were removed for convenience. (A) Phylogenetic analysis of the Arabidopsis and rice AGO proteins. The protein sequences of AtAGO1 to AtAGO10 were obtained from the Arabidopsis Information Resource (http://www.arabidopsis.org). Rice protein sequences were from the Institute for Genomic Research. ClustalW (www.ebi.ac.uk/Tools/clustalw2) was used to align the sequences, and MEGA4 was used to generate the phylogenetic tree using the neighbor-joining and the Poisson correction methods. Bootstrap values were calculated with 1000 permutations. The scale bar represented 0.1-amino-acid substitutions per residue. (B) Expression profiles of rice AGO genes. The most homologous Arabidopsis genes were labeled. The bar represented the scale of relative expression levels of AGO genes and the expression signals were Log2 transformed.

