Figure 6.
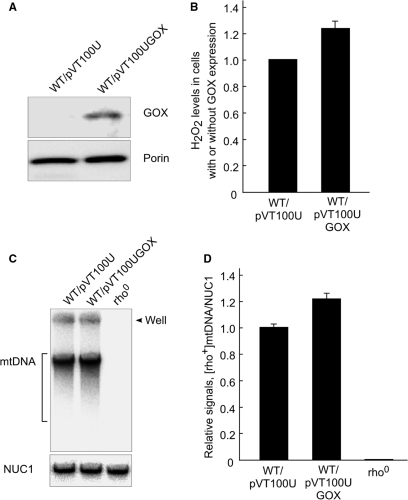
Effects of GOX expression on mtDNA copy number. (A) Western blot analysis for GOX expression. Cells harboring pVT100U or pVT100UGOX were grown at 30°C in an SD medium supplemented with required amino acid from 1.0 × 10⁵ cells/ml to 2.0 × 10⁷ cells/ml. About 10 μg of total proteins from each strain were analyzed on 10% SDS polyacrylamide gel electrophoresis. GOX and porin were detected by Western blot analysis using monoclonal antibodies. (B) Determination of hydrogen peroxide generation due to GOX expression. Cells harboring pVT100U or pVT100UGOX were grown under the same conditions as described above. The elevated levels of hydrogen peroxide caused by glucose oxidase activity were determined. Averaged values of relative hydrogen peroxide levels, which were obtained from three independent experiments, are plotted. Hydrogen peroxide level in cells harboring an empty vector was set as 1. (C) Southern blot analysis for relative mtDNA copy number. Cells harboring pVT100U or pVT100UGOX were grown under the same conditions as described in A. About 20 μg of total cellular DNA isolated as described (21) was electrophoresed on a 1.0% agarose gel. mtDNA was detected using 32P-labeled [rho+] mtDNA as probes (upper panel). After the 32P-labeled [rho+] mtDNA probe was washed out, the same membrane was probed using a 32P-labeled DNA fragment containing the nuclear NUC1 gene (bottom panel). (D) Quantitative analysis of the relative amounts of mtDNA. The average values of the ratios of the signals from mtDNA versus those from the NUC1 open reading frame, obtained from three independent experiments, are plotted.

