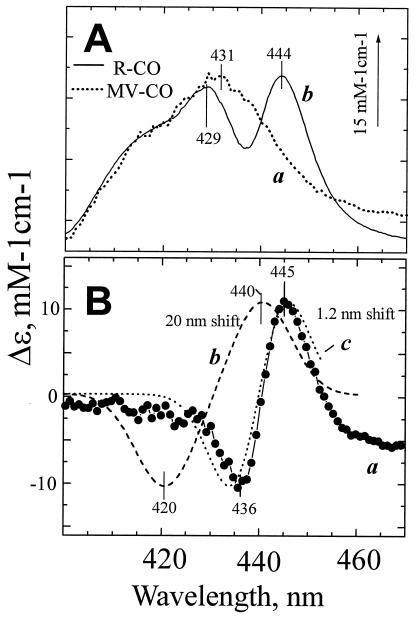
Figure 3.
A red shift of ferrous heme b595 absorption band induced by CO dissociation from heme d. (A) (a) Absorption changes induced by CO photodissociation from the MV and (b) static unliganded-CO − liganded spectrum of the R state (difference between curves a and b of Fig. 1A). The curves have been normalized by aligning their blue parts where they have similar line shapes. The scale bar refers to the R-CO state response. (B) Curve a gives the difference between spectra b and a in A. For comparison are shown simulated difference spectra for a 20-nm red shift corresponding to CO dissociation from heme b595 in ≈10% of cytochrome bd (b) and a 1.2-nm red shift of the entire population of b595 (c).

