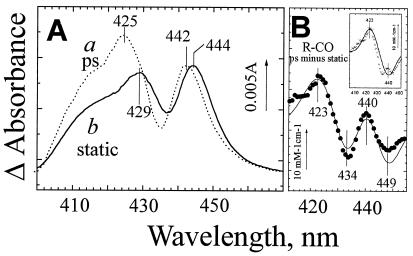
Figure 4.
Evidence for an unrelaxed intermediate state of ferrous heme b595 after CO photodissociation from heme d. (A) Absorption changes induced by CO dissociation from the R-CO state of cytochrome bd shortly after photolysis (a) and under static conditions (b). Curve a corresponds to the difference spectrum resolved by global analysis as a residual constant phase after relaxation of the excited states. Curve b is the difference spectrum (inverted) induced by addition of 20 μM CO to the fully reduced cytochrome bd (the same curve as in Fig. 3A). The spectra have been normalized by the height of the 442-to 444-nm peak. The ΔA scale bar refers to curve a. (B). The experimental difference between spectra a and b in A (●) has been simulated (the line) as narrowing of the b595 440-nm band by 10% plus a 17-nm blue shift of this band in 10% of cytochrome bd. The Gaussian approximation of the band in Fig. 1D has been used for modeling. (Inset) After subtracting the contribution of b595 band narrowing, the difference between the picosecond and static CO photodissociation spectra (crosses) is dominated by the 17-nm blue shift of heme b595 (solid curve).

