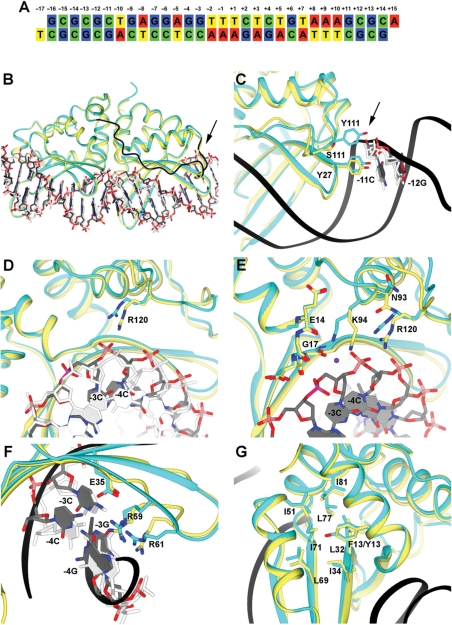
Figure 6.
Structural analysis of the Y2 I-AniI construct. Electron density maps for several of the structural features shown here are provided in Supplementary Figure S3. For clarity of viewing, the orientation of the structure shown in panels B–G are rotated 180°C relative to the canonical orientation of the DNA substrate sequence shown in panel A. (A) Sequence of the DNA duplex used for the crystallization. The target site (20 basepairs) is numbered from positions −10 to +10, relative to the center of the four-base overhangs generated by DNA cleavage. The strand breaks are introduced between positions +2 and +3 in the top strand, and between −2 and −3 in the bottom strand. (B) Y2 I-AniI (cyan) in complex with the DNA duplex (grey) superimposed against WT I-AniI (light yellow) bound to the same DNA target sequence (white) (PDB: 2QOJ). The extended loop of Y2 I-AniI linking the N-terminal and the C-terminal domains is shown in dark blue. The arrow in panel B and C points towards S111Y. (C) Magnification of region surrounding residue 111 (S111Y mutation in the Y2 I-AniI construct). (D) Magnification of region surrounding residue 120. (E) Magnification of region surrounding residue 94 and its surrounding active site residues and DNA bases. (F) Magnification of region surrounding basepairs −3 and −4. (G) Magnification of region surrounding residue 13 (F13Y in the Y2 I-AniI construct).

