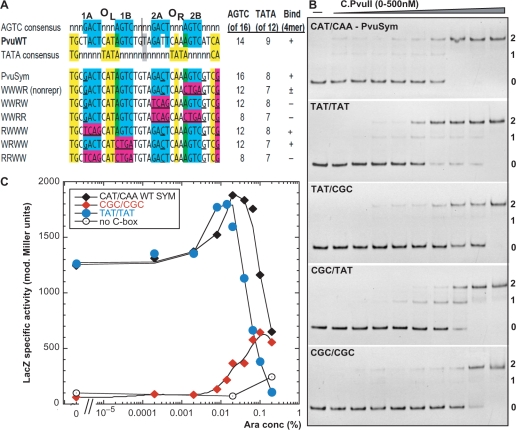
Figure 2.
Testing the two alternative symmetry patterns in the C-box region. (A) Two alternative symmetry patterns. The top portion shows the ‘AGTC’ consensus [in blue, (33)] comprising the C-box elements themselves, the actual sequence from PvuII R-M system, and the ‘TATA’ consensus [in yellow, (41)]. The centers of symmetry are shown. The numbers at the right indicate the extent of match to each consensus, and whether a characteristic repression complex forms in vitro at ≤500 nM C.PvuII. The lower portion shows several previously tested C.PvuII operator variants (28). Magenta shading indicates mutations introduced in each case, in the context of symmetrized C-boxes (underlined positions). (B) Binding effects of ‘TATA’ consensus alteration. A series of 126-bp dsDNA-binding targets were prepared by PCR amplification, and included in each binding reaction at 20 nM. The DNAs contained WT or variant C boxes flanked on either side by 50 bp of native PvuII sequence. EMSA reactions with concentrations of C.PvuII increasing from 0–500 nM were processed as outlined in ‘Materials and methods’ section. PvuSym indicates wild-type spacers in the context of symmetrized C-box sequences (see sequence in A). Other variants are in the same sequence context, but with different intra-operator spacers as indicated (OL/OR). Reactions were resolved on 10% native polyacrylamide gels, and DNA was visualized by staining with ethidium bromide. Numbers at right indicate the expected numbers of bound C.PvuII dimers. (C) In vivo titration of intra-operator spacers variants with C.PvuII. Cells, carrying pvuIIC under the control of PBAD, were grown in minimal media with 0.2% glucose and the indicated concentration of arabinose, as described before (28). Expression from variants (labeled as in B) was measured via transcriptional fusion of the variant C-boxes/PpvuIICR to reporter gene lacZ. Each point represents β-galactosidase specific activity, determined by linear regression of the plot of LacZ activity (modified Miller units) versus optical density of the culture, as previously (49). Each point represents the slope of a regression from at least 3 points; in all cases R2 was >0.97. The beginning of the curve (0), indicates values obtained in glucose with no arabinose. Black diamonds represent LacZ activity from cells with the WT symmetrized PvuII C-boxes with CAT/CAA intra-operator spacers (pIM8). The ‘TATA’ consensus variant (TAT/TAT) is shown as blue circles, and the ‘TATA’-disrupted variant (CGC/CGC) is shown as red diamonds. As negative control vector plasmid with no pvuIIC was used (open circles).

