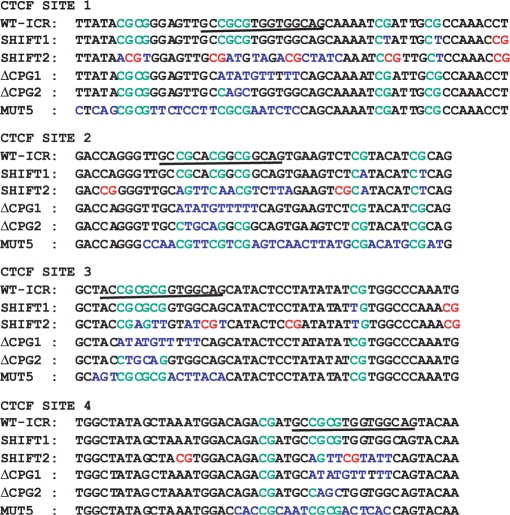
Figure 2.
CTCF sites in the ICR mutants. Wild-type sequence surrounding the four CTCF sites in the Igf2/H19 ICR is shown in black, except for CpGs, which are green. In the mutant ICRs, altered bases are shown in blue, except for new CpGs, which are red. Further description of the ICR mutants is in the text and Supplementary Figure S1. The core of each CTCF site is underlined.

