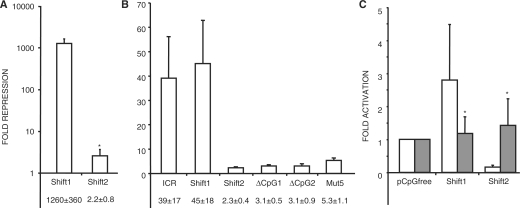
Figure 3.
Sequence-specific repression by CpGs associated with CTCF sites in the ICR. (A) Logarithmic graph of the relative repression of methylated plasmids in stable transfections of F9 cells. (B) Graph of the relative repression of methylated plasmids in stable transfections of NIH3T3 cells. (C) Expression of unmethylated reporter plasmids relative to unmethylated pCpGfree in stable transfections of F9 (empty) and 3T3 cells (gray). (A–C) Mean values and standard deviations below the graphs are from three independent experiments. All means have P-values < 0.05 when compared with unmethylated control plasmids, except where indicated by asterisk. Methylated sequences are indicated below the graphs. Sequences: Shift1, CpG-Shift1; Shift2, CpG-Shift2, ΔCpG1, ICR-ΔCpG1; ΔCpG2, ICR-ΔCpG2; Mut5, ICR-Mut5.

