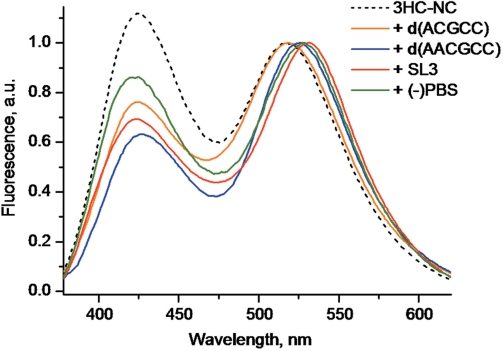
Figure 7.
Normalized fluorescence spectra of 3HC-NC(11–55) complexes with SL3 (red), (−)PBS (green), d(ACGCC) (orange) and d(AACGCC) (blue). The spectrum of the free 3HC-NC(11–55) peptide is given for comparison (dashed black curve). Peptide concentration was 0.2 µM with a 3HC-NC(11–55)/ODN ratio of 1:2 for SL2 and (−)PBS. The buffer was 10 mM phosphate, 100 mM NaCl, pH 7.0. To ensure complete peptide binding with d(ACGCC) and d(AACGCC), the salt concentration was decreased to 30 mM, while the peptide and ODN concentrations were raised to 1 µM and 10 µM, respectively. In these conditions, about 95% of the peptide was saturated by the ODNs (50).

