
Figure 2.
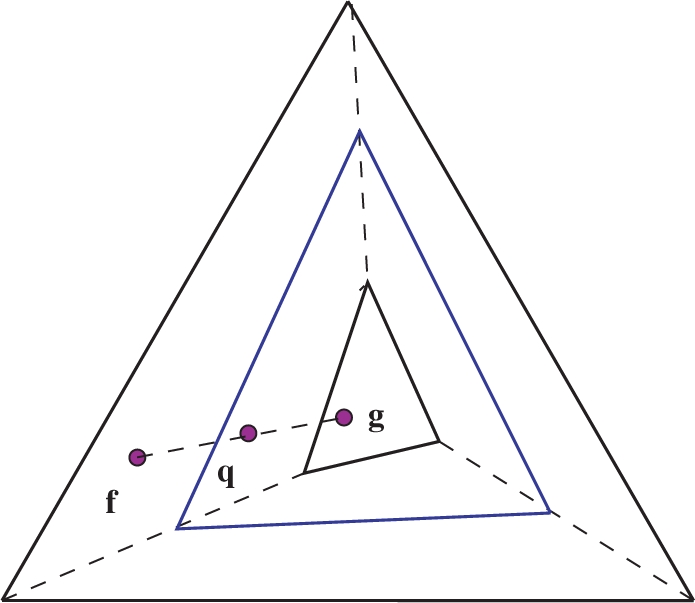
Linear transformations of frequency distribution space. A substitution matrix imposes a linear transformation M that maps each observed frequency vector f to a pseudocount vector g, and all of frequency distribution space to the smallest simplex shown. For values of α between 0 and 1, the use of pseudocounts imposes a linear transformation  that maps f to a point q on the line between f and g, and the frequency distribution space to the intermediate simplex shown.