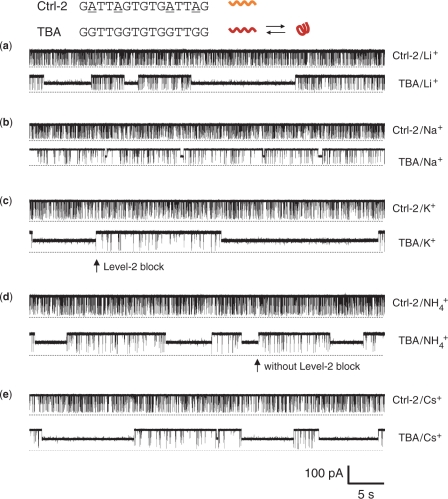
Figure 2.
Current traces from a single αHL pore showing blocks with Ctrl-2 and TBA in the presence of various monovalent cations. The concentration of both DNAs was 2.5 μM. All traces were recorded at +100 mV in a 1 M salt solution buffered with 10 mM Tris (pH 7.2). The top trace of each panel was recorded for Ctrl-2 and the bottom one for TBA in solutions of (a) LiCl, (b) NaCl, (c) KCl, (d) NH4Cl and (e) CsCl.

