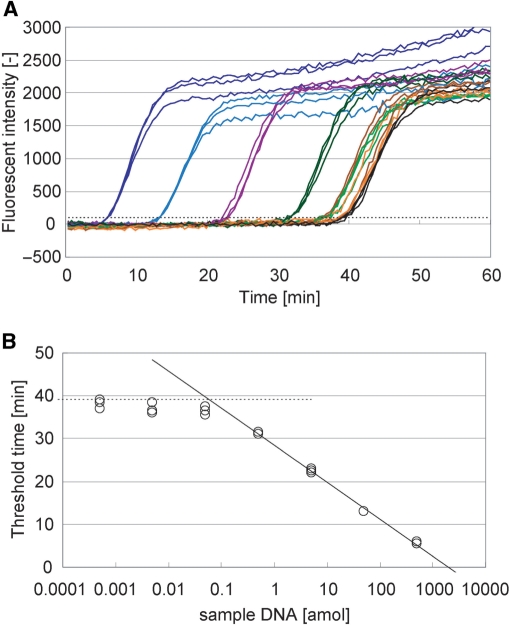
Figure 3.
Real-time product analysis of PG–RCA. (A) Fluorescent intensity of PG–RCA reaction was monitored in real time. PG–RCA was conducted at 60°C with 400 µM each dNTP, 0.4 U Vent (exo-) DNA polymerase, 1 U Nb.BsmI and 7.5 nM circular probe II as described in Materials and methods section. Sample DNA concentration in each reaction was prepared by 10-fold serial dilution from 500 amol to 0.5 zmol, and their signal amplification curves were indicated by colored lines (blue, light blue, purple, dark green, green, brown and orange, respectively) (n=3). Negative controls are indicated by black lines (n=3). (B) Threshold time TT (the reaction time when fluorescent intensity of each reaction exceeds a threshold, indicated by a perforated line in Figure 3A) was plotted against the sample DNA concentration (S) of the reaction. Solid line indicates linear least squares fitting between 500 and 0.5 amol sample DNA and its formulation is TT=−8.65 log10(S)+28.5 (R2=0.997). Perforated line indicates average TT value of the negative controls. Limit of detection is 58.4 zmol or 3.50 × 10⁴ molecules of sample DNA by calculation from the intersection of both lines.

