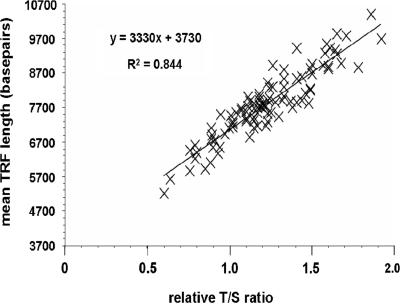
Figure 5.
Correlation of relative T/S ratios measured by MMQPCR with albumin as the single copy gene, and mean TRF lengths determined by Southern blot analysis, in whole blood DNA samples from 95 individuals. Each T/S value is the average of triplicate measurements; each mean TRF length is the average of duplicate measurements. The linear regression equation and correlation coefficient were determined using Microsoft Excel.

