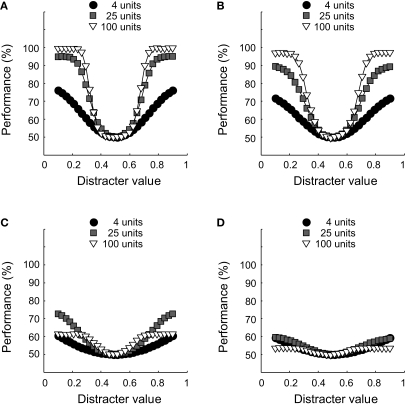
Figure 11.
The effect of pool size and correlated noise on classification performance. (A) Classification performance at ID-train is plotted as a function of distracter value for three different pool sizes (as indicated by the Figure legend). Results in (A) are from networks without correlated noise. (B) Same as in (A) for networks with correlated noise. (C) Classification performance at the most remote ID-test location, results are from networks without correlated noise. (D) Same as in (C) for networks with correlated noise.

