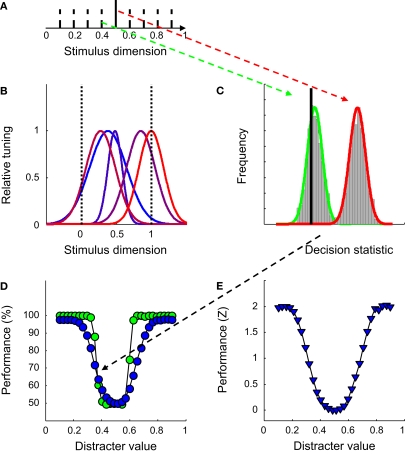
Figure 2.
The introductory experiment. (A) The network was trained to discriminate a 1-D signal (full black line) from a 1-D distracter, randomly selected from a set of eight distracters (dotted black lines) on each trial. (B) The Gaussian-shaped tuning functions for one particular network. (C) Estimates of the distribution of the decision statistic computed by the SVM for the signal (in red) and one particular distracter (in green) for one network, based on 1,000 trials. The full black line depicts the decision boundary used by the SVM to classify network responses. (D) Classification performance as a function of distracter value in the identification test. Green symbols indicate results for the network shown in Figure 1B, blue symbols results averaged over 100 networks. (E) Normalized average classification performance as a function of distracter value. These data correspond to the blue symbols shown in panel (D). After normalization, performance is expressed in units of standard deviation above (or below) guess rate. Averaging over all 30 distracter values yields the sensitivity statistic used throughout the paper.

