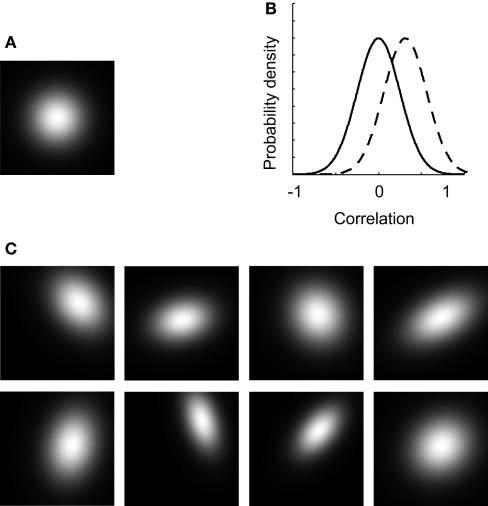
Figure 7.
The effect of dependent tuning. (A) The average 2-D unit tuning function for a particular network. (B) The correlation-distributions used in experiment II. (C) Some example unit tuning functions corresponding to the average tuning width shown in panel (A) and the correlation-distribution depicted by the full line in panel (B).

