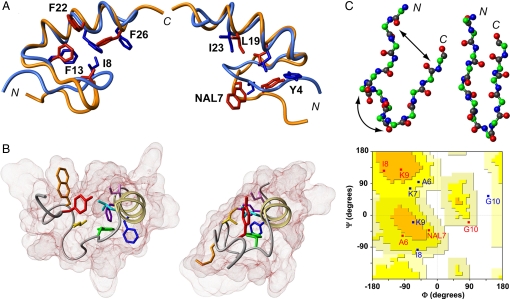
Fig. 4.
Structural basis for degenerate folding. (A) Superposition of FSD-1ss lowest-energy NMR structure at 323 K (red structures) and the averaged minimized FSD-1 structure at 275 K (blue structures) (18). The 2 views highlight different subsets of the main hydrophobic core residues. Numbering and sequences are as shown in Fig. 1B. (B) Comparison between FSD-1ss (Left) and FSD-1 (Right) structures. The backbone is shown as a ribbon, and the van der Waals surfaces are shown in shades of brown. The core side chains are colored according to the spectrum of light to indicate sequence order (from red to purple). (C) Comparison of backbone conformation in the N-terminal segment of FSD-1ss (Upper Left) and FSD-1 (Upper Right), by using a ball and sticks representation. The arrows highlight the structural differences. (Lower) Ramachandran plot showing the dihedral angle values of residues 6–10 in FSD-1ss (red) and FSD-1 (blue).

