
Figure 3.
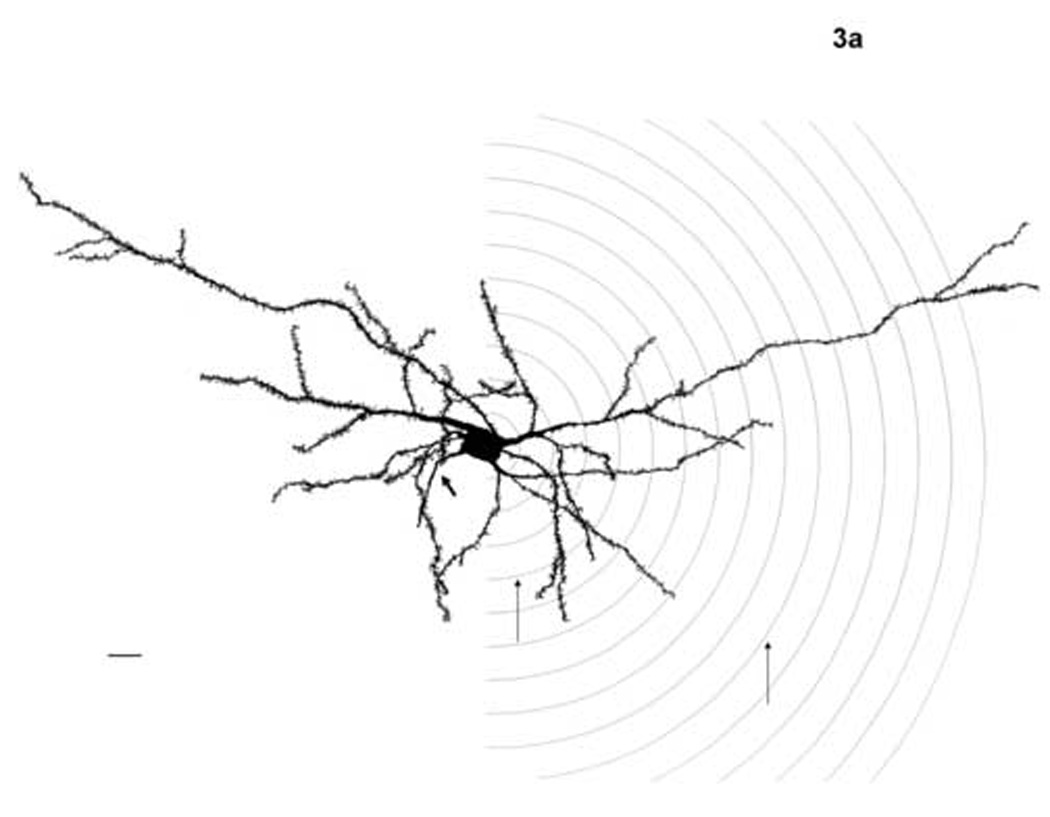
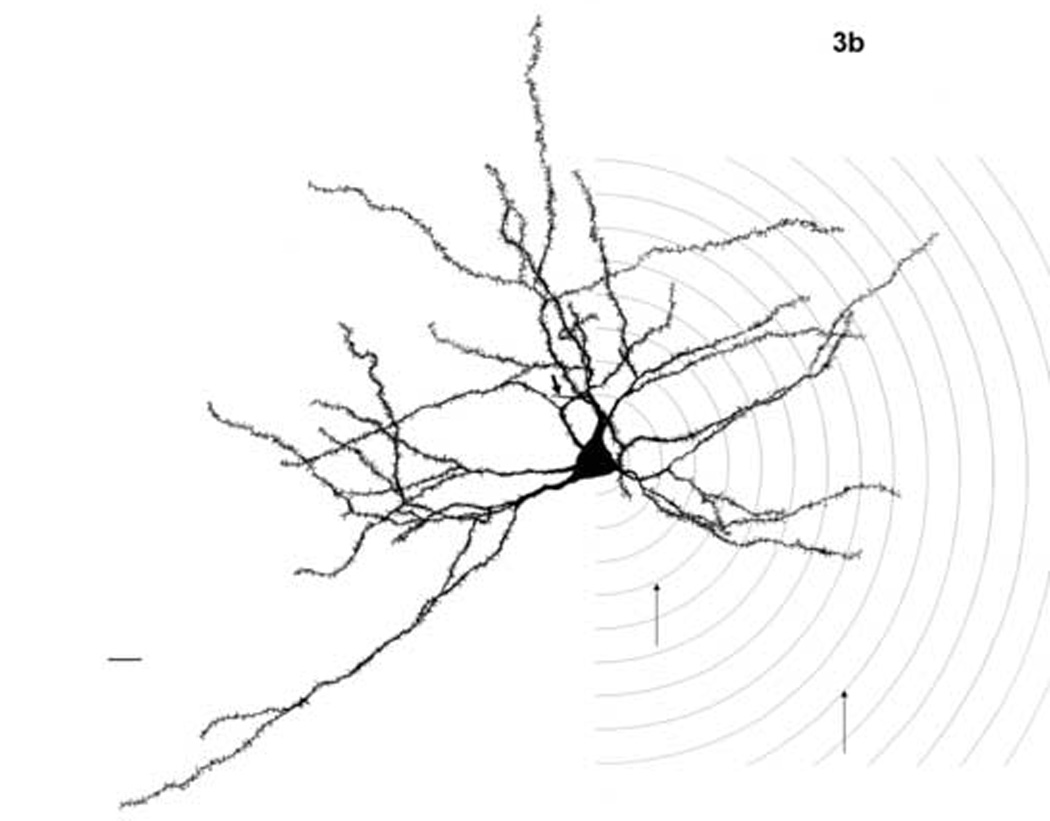
Camera lucida drawings of basolateral nucleus principal neurons from young adult (a) and aged (b) subjects, both female. Thick arrow indicates axon in both figures. Sholl rings are illustrated on the right half of the illustrations. Thin arrows indicate rings 4 and 10, boundaries of the 80–200 µm range from the soma center where age differences were found. Scale bars = 20 µm.