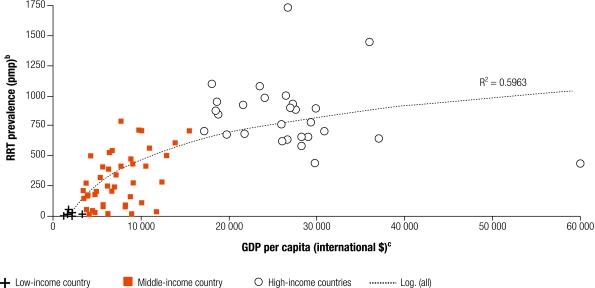
Fig. 1.
Prevalence of patients receiving RRT, as at 31 December 2002, and GDP per capitaa
GDP, gross domestic product; pmp, per million population; RRT, renal replacement therapy.
a Classification of countries into low-, middle- and high-income are according to World Bank Analytical Classifications based on GNI per capita in US$ (2002).
b Data on RRT prevalence from: USRDS Annual Data Reports 2004 & 2005 (www.usrds.org); ERA-EDTA Registry Annual Reports 2002, 2003 & 2004 (www.era-edta-reg.org); Registro Latinoamericano de Diálisis y Trasplante Renal: Informe 2003 (www.slanh.org/registro/); United Kingdom Renal Registry Report, 2003 (www.renalreg.com); Barsoum R, Kidney Int Suppl 2003;63:S111; Sitprija V, Kidney Int Suppl 2003;63:S128; Naicker S, Kidney Int Suppl 2003;63:S119; D’Amico G, Kidney Int Suppl 2005;98:S46.
c Data on GDP per capita refers to purchasing power parity (PPP) international dollars 2002, obtained from World Bank’s World Development Indicators, 2005.

