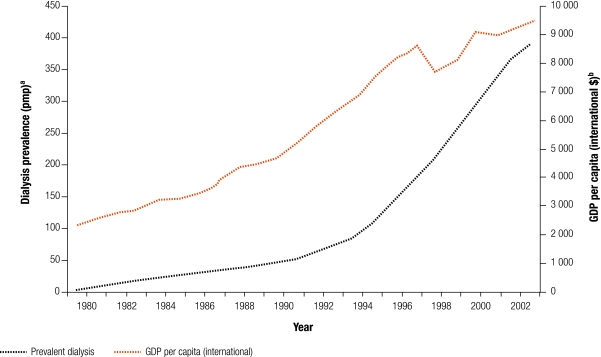
Fig. 4.
Dialysis prevalence rate compared with GDP per capita in Malaysia from 1980 to 2003
GDP, gross domestic product; pmp, per million population.
a Data on dialysis prevalence from: Eleventh Report of the Malaysian Dialysis and Transplant Registry 2003 (www.msn.org.my/nrr/).
b Data on GDP per capita refers to purchasing power parity (PPP) international dollars 2002, obtained from World Bank’s World Development Indicators, 2005.

