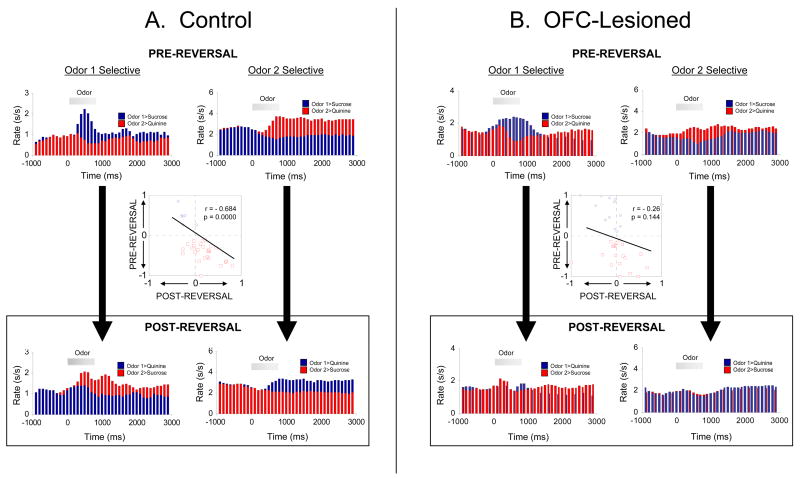
Figure 3.
Flexibility of associative encoding in ABL depends on input from OFC. Population response of cue-selective neurons in ABL in control rats (A), or in rats with ipsilateral lesions of OFC (B). Average activity per neuron is shown, synchronized to odor onset, before and after reversal. Unlike the populations recorded in intact rats, the population response recorded in OFC-lesioned rats does not reverse cue-selectivity. Inset scatterplot compares the cue-selectivity indices before (X-axis) and after reversal (Y-axis) for all the cue-selective neurons used to construct the population histograms. Blue and red symbols show data for “Odor 1 Selective” neurons and “Odor 2 Selective” neurons, respectively. Again, in contrast to the inverse correlation in intact rats, the cue-selectivity indices in OFC-lesioned rats showed no correlation, indicating that ABL neurons in OFC-lesioned rats had lost their tendency to reverse. Data adapted from Stalnaker et al., Nature Neuroscience, 2007 and Saddoris et al, Neuron, 2005.

