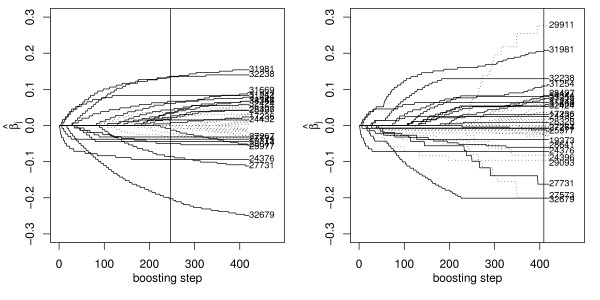
Figure 1.
Coefficient paths for the DLBCL data. Coefficient paths for boosting without pathway information (left panel) and PathBoost (right panel), applied to DLBCL data. The models selected by 10-fold cross validation are indicated by vertical lines. Microarray features common to both models are indicated by solid curves, the others by dotted curves.

